| Dataset name | rt-me-fMRI |
| Subject ID | 001 |
| Report date/time | 01-Dec-2020 20:51:34 |
| Anatomical resolution | 1x1x1 mm (100x100x100 voxels) |
| Functional resolution | 3.5x3.5x3.5 mm (64x64x34 voxels) |
| Functional acquisition | Multi-echo (TE = 14,28,42 ms), SENSE = 2.5 |
| Functional runs | rest_run-1, fingerTapping, emotionProcessing, rest_run-2, fingerTappingImagined, emotionProcessingImagined |
The T1w anatomical image was coregistered to the template functional image (task rest, run 1, echo 2, volume 1)
using SPM12 coregister/estimate functionality.
Before resampling to the functional resolution, this coregistered T1w image was segmented using tissue probability
maps and SPM12's unified segmentation algorithm.
This yielded subject-specific probability maps for gray matter, white matter, CSF, soft tissue, bone and air in
the subject functional space.
All of these probability maps where then resampled (using coregister/write) to the subject functional
resolution.
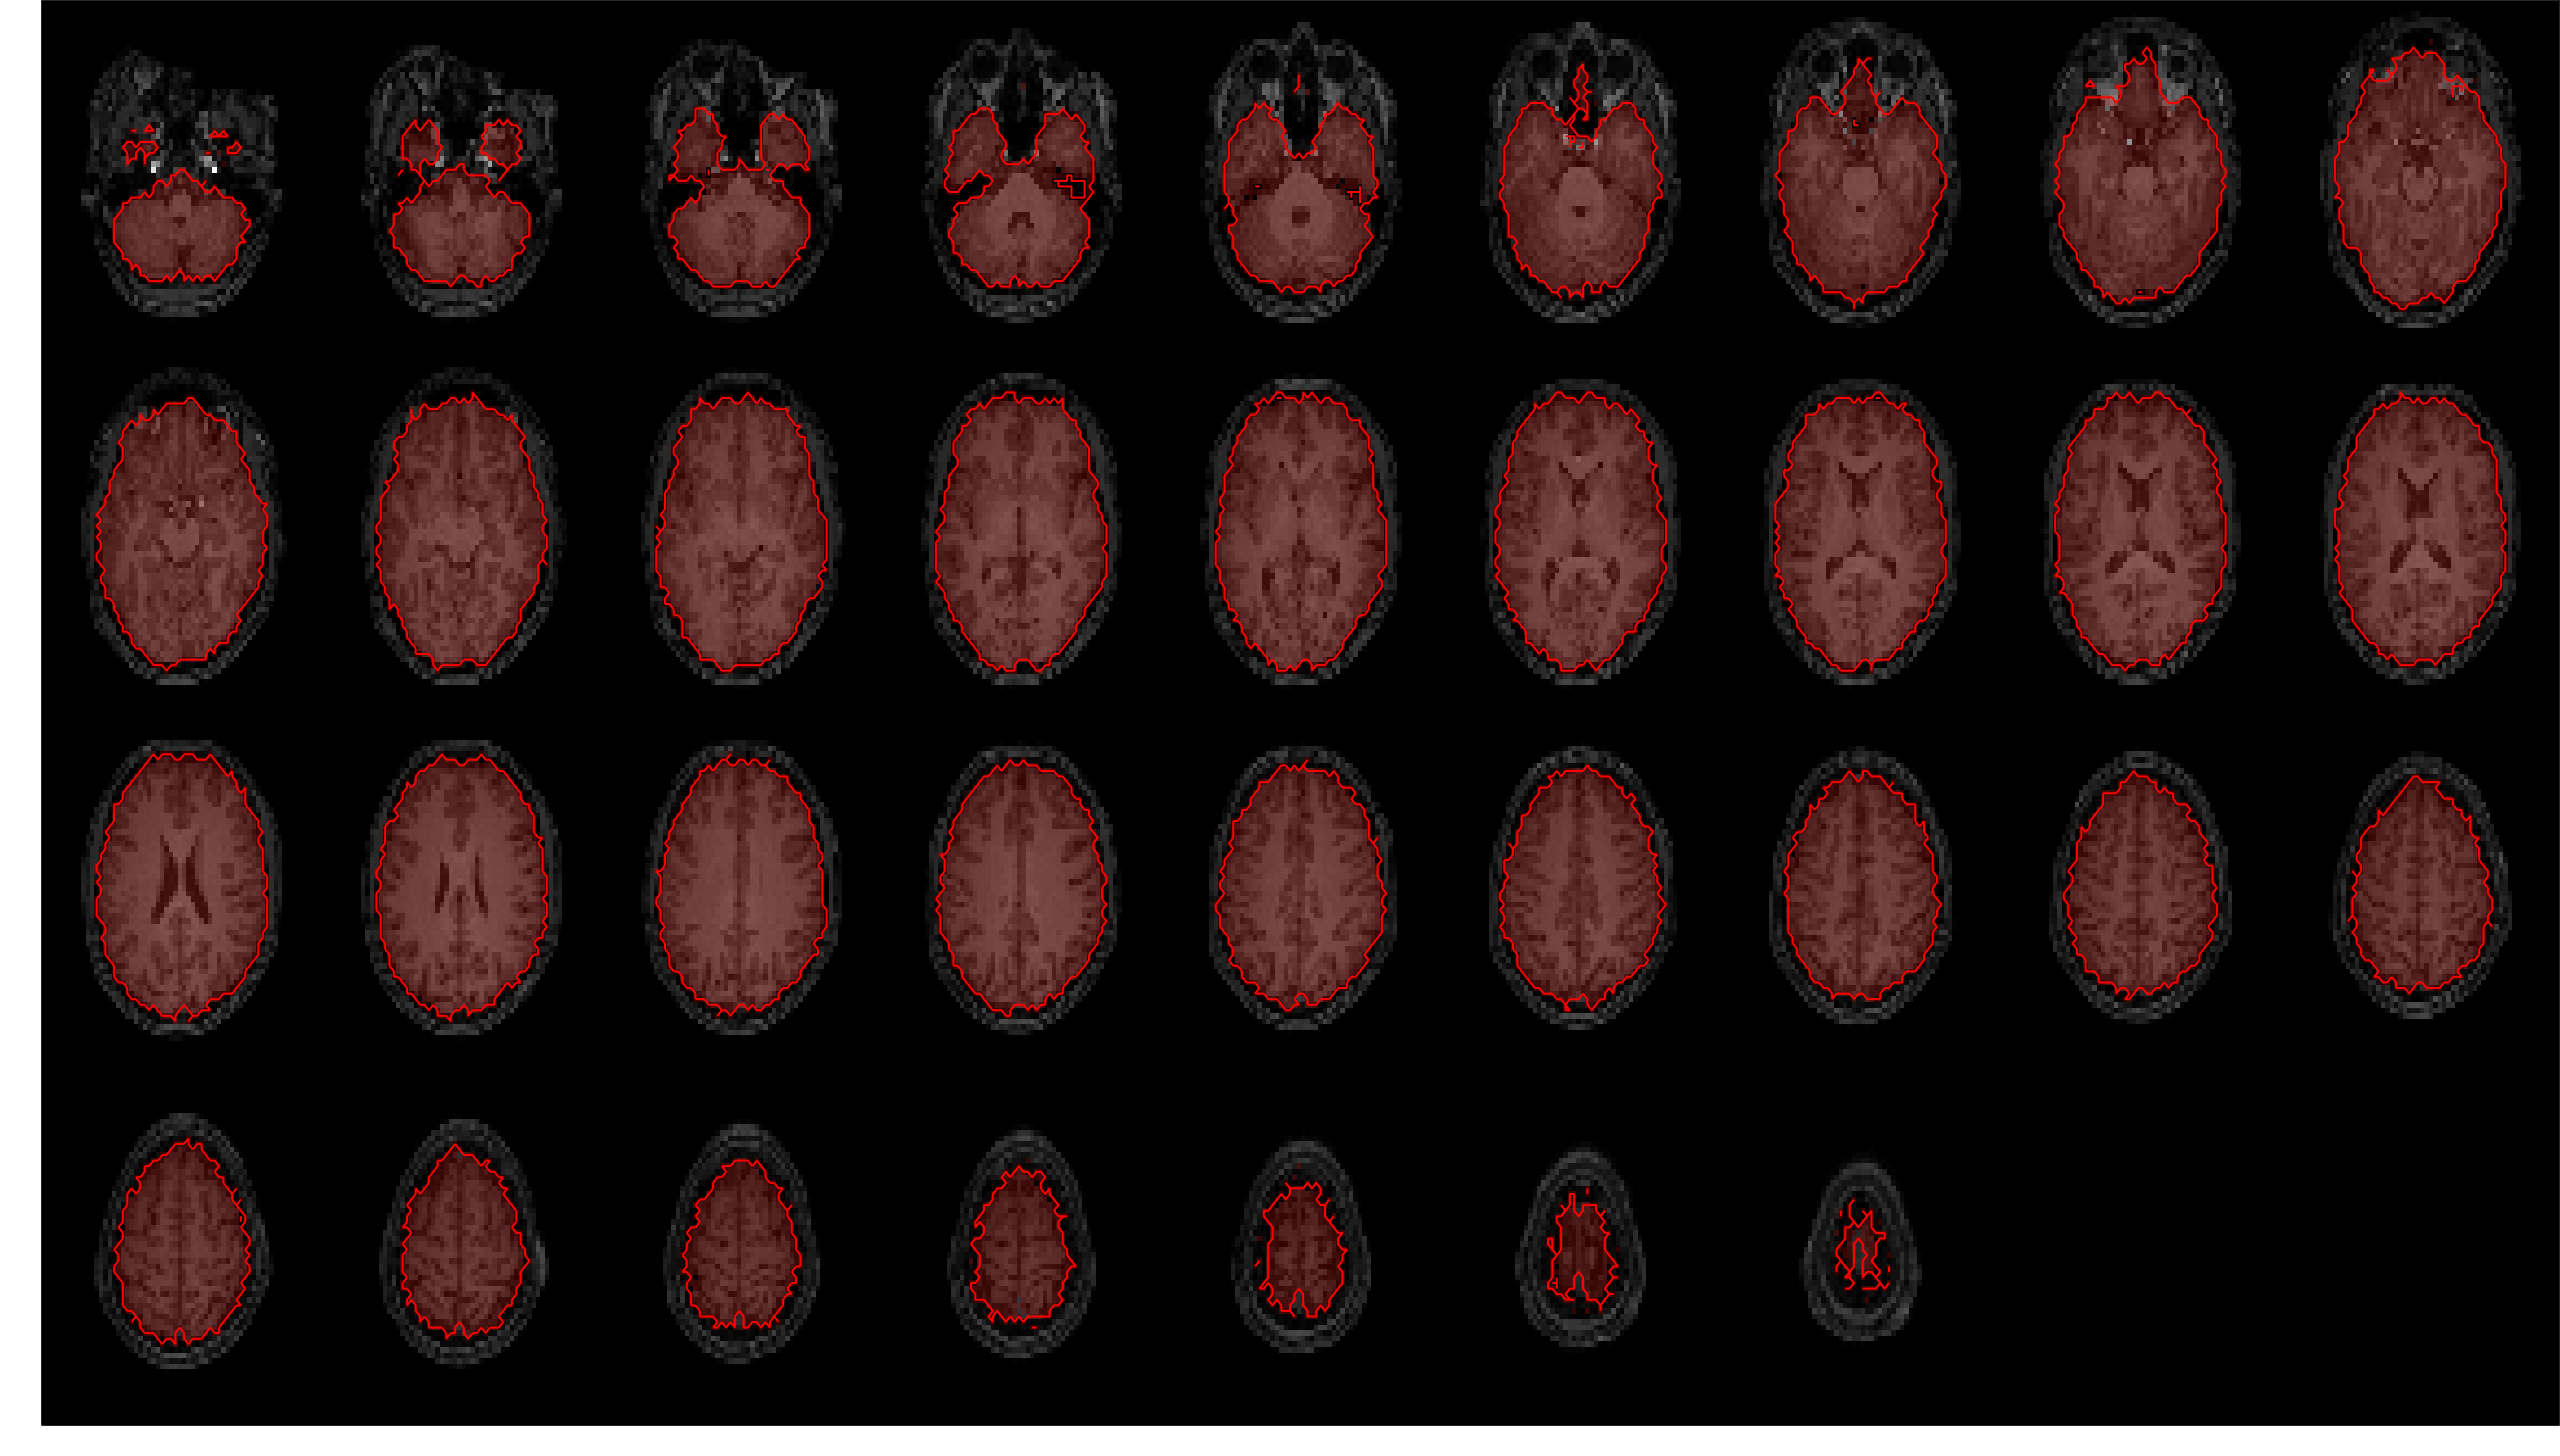
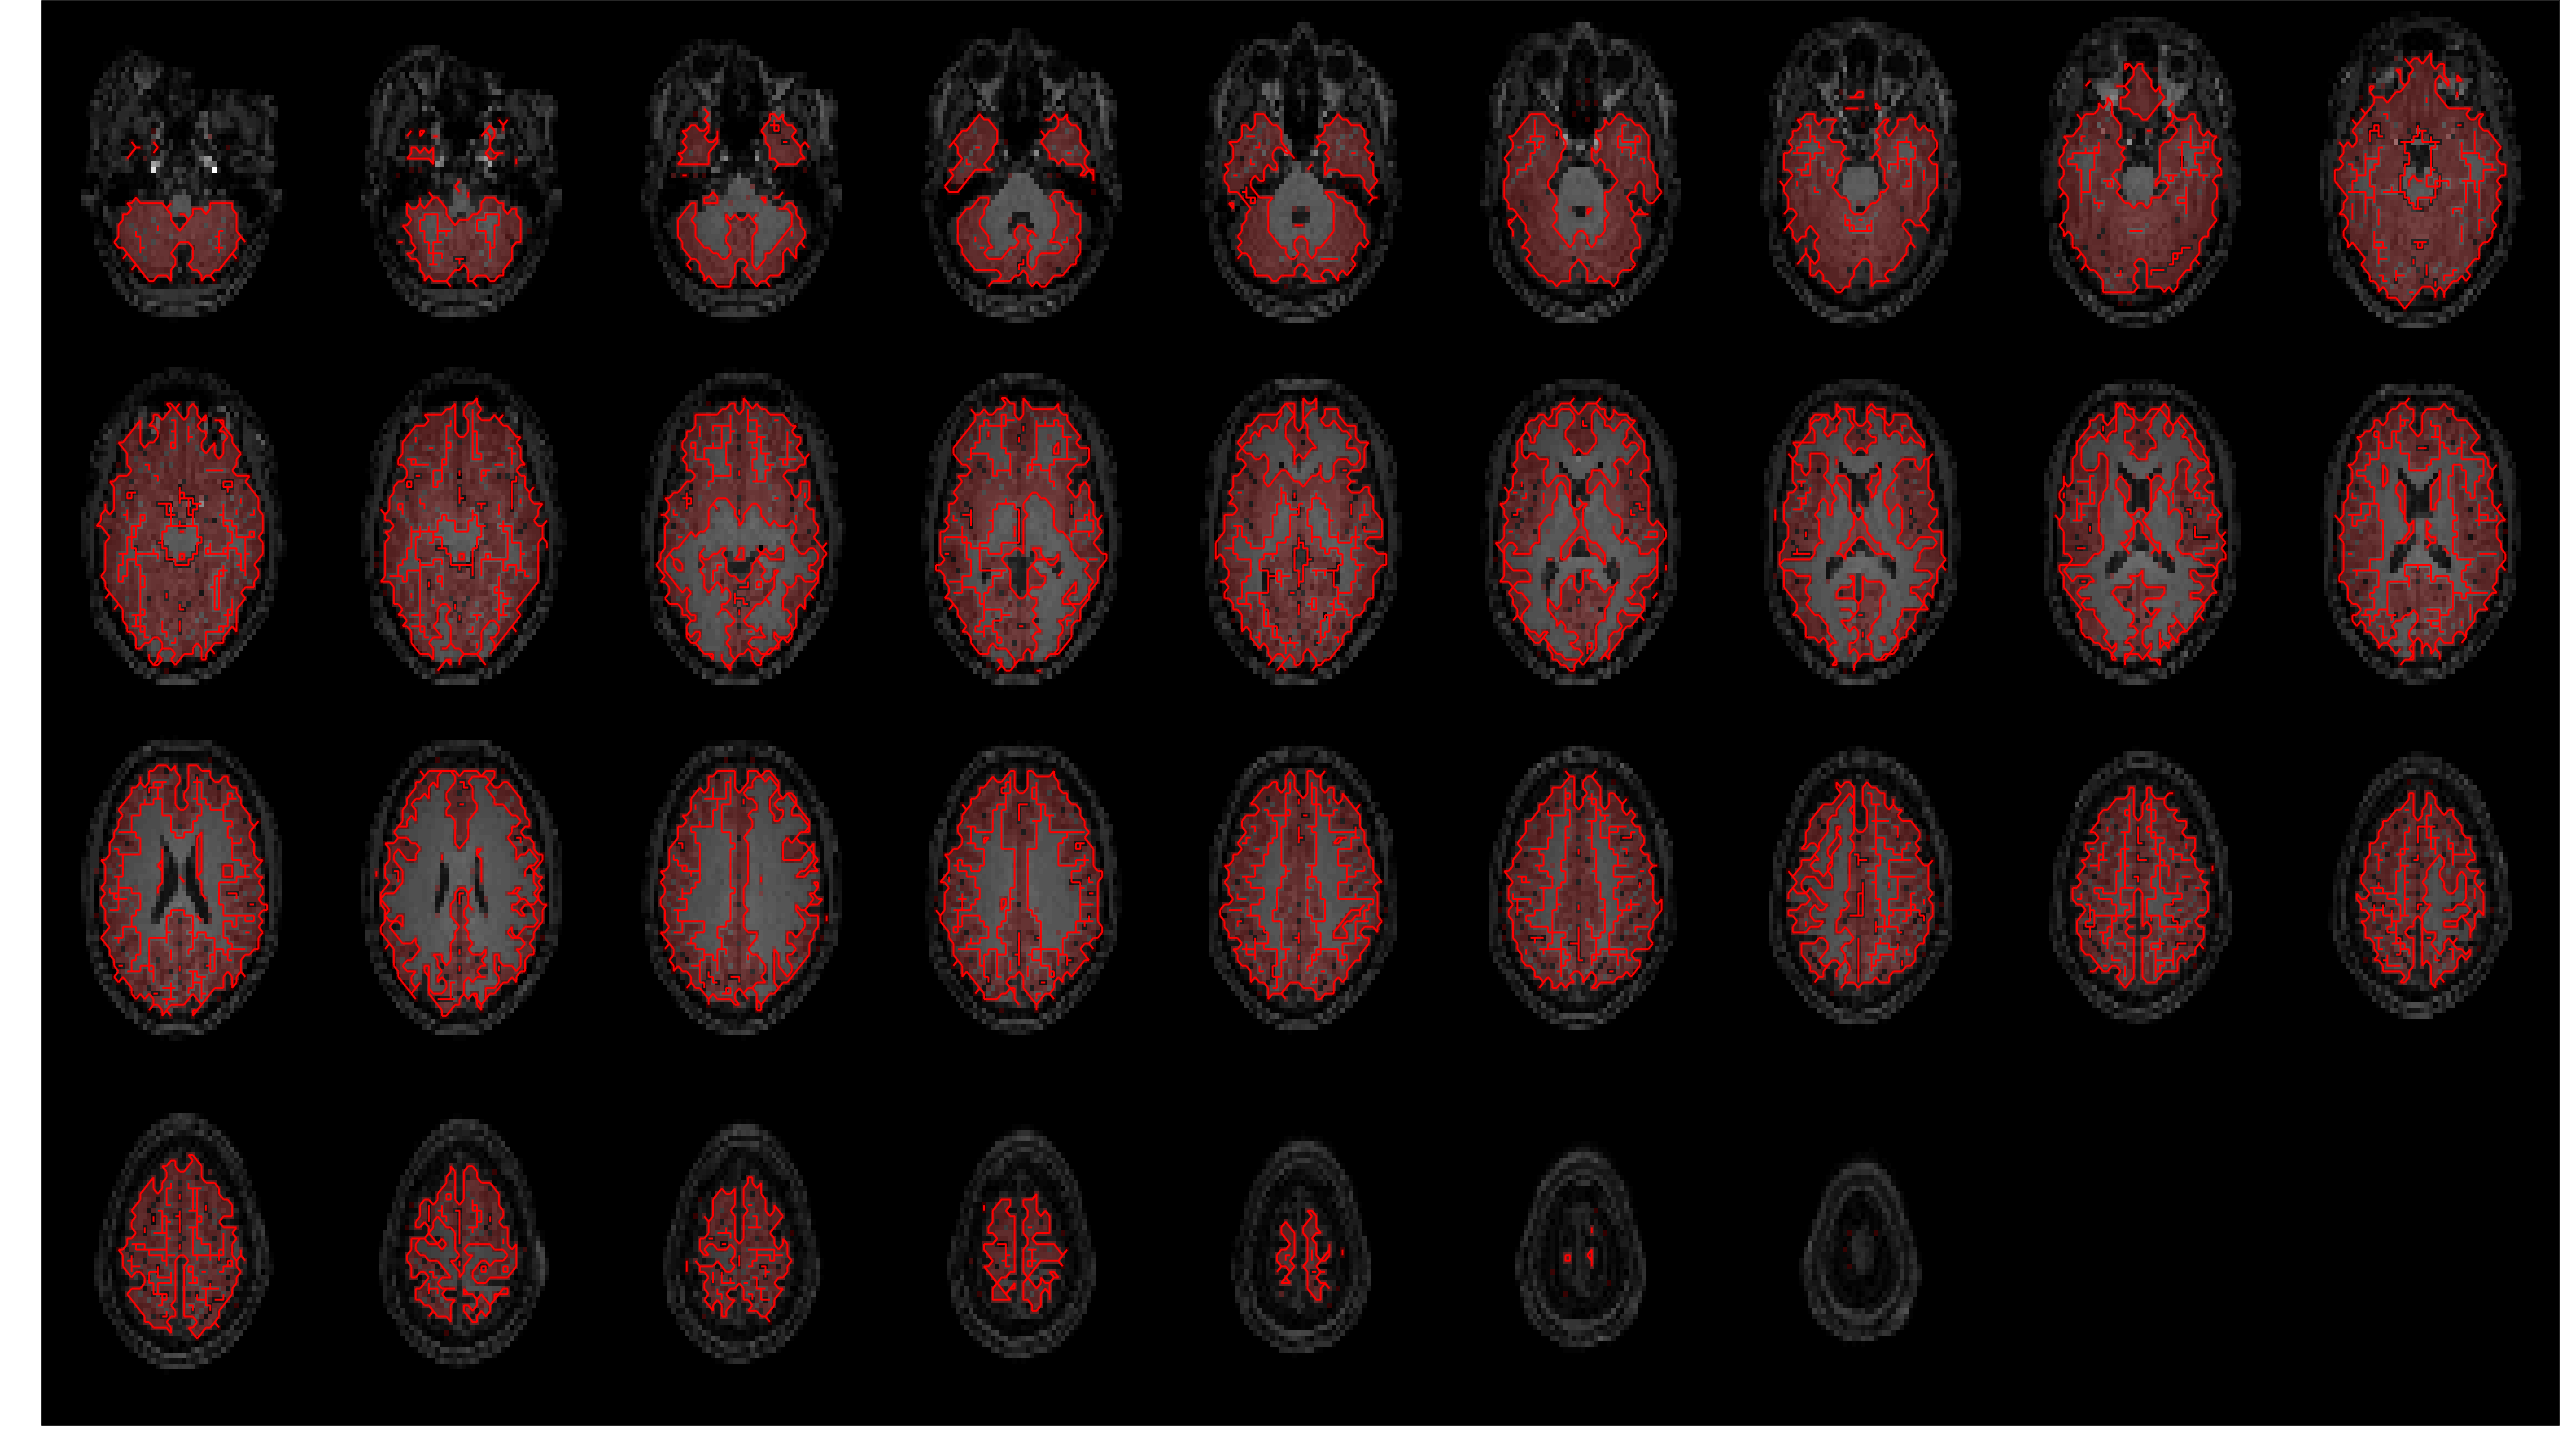
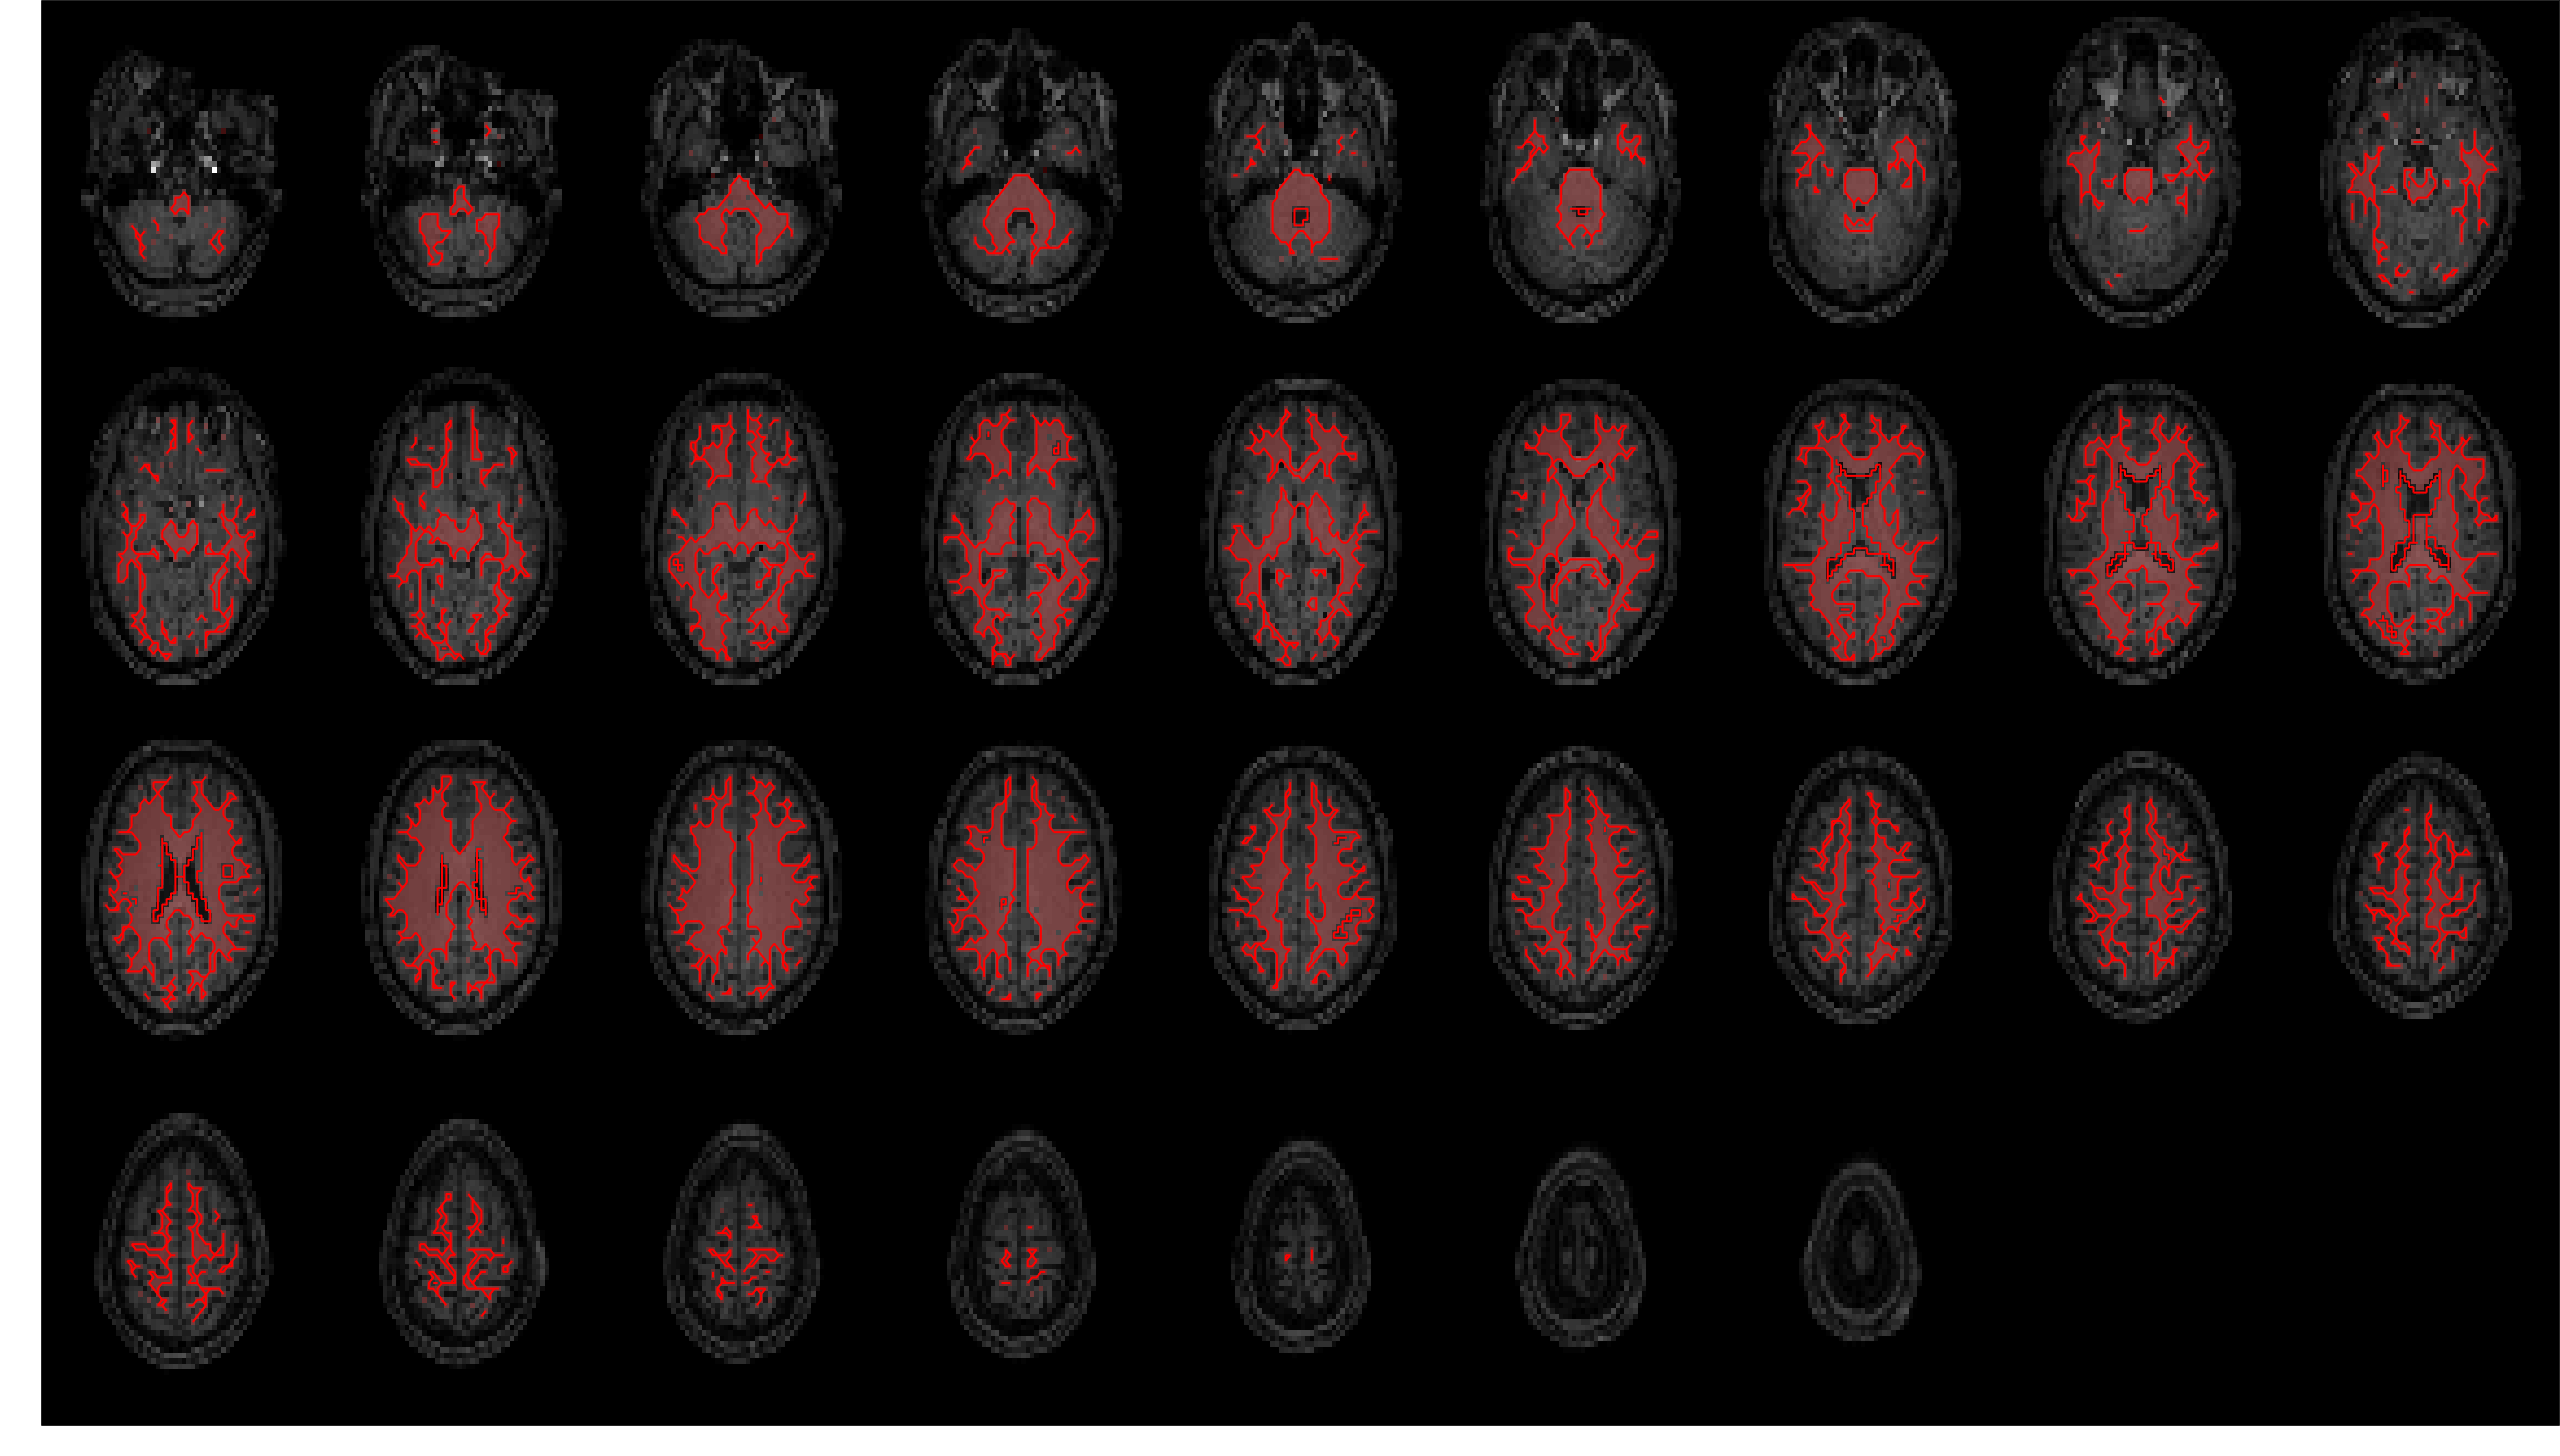
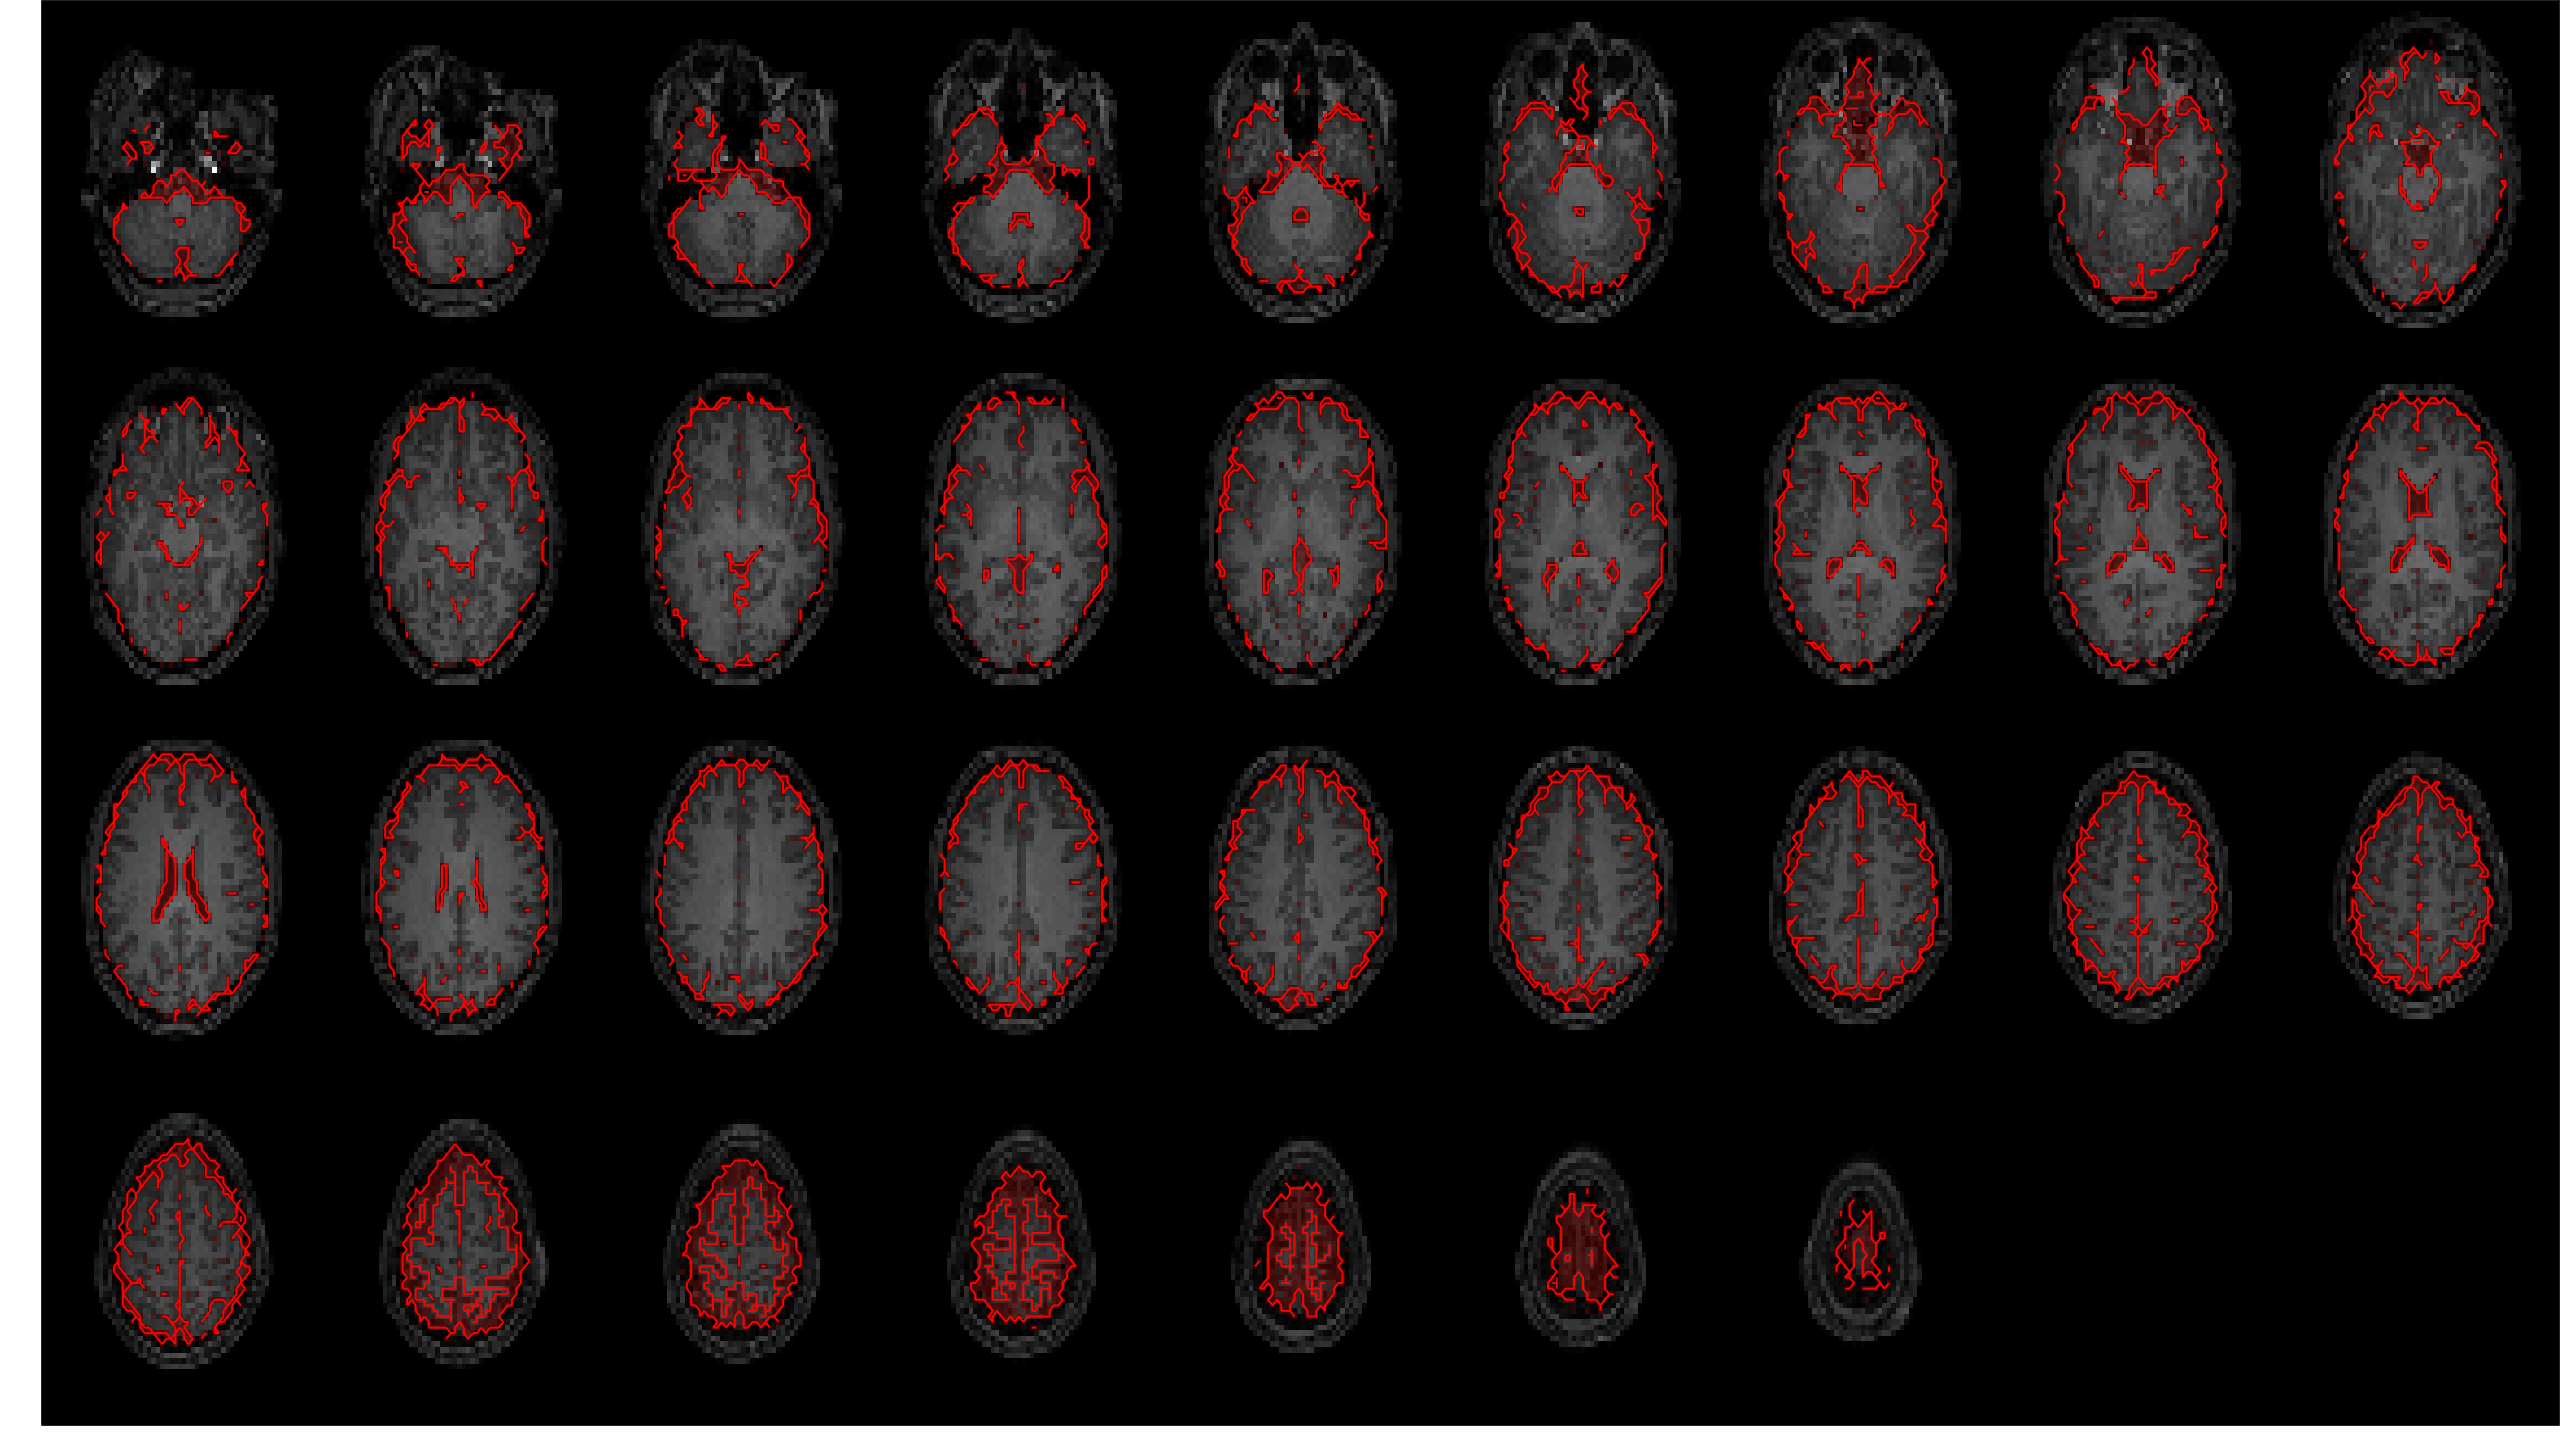
Masks were generated for gray matter, white matter, CSF, and the whole brain (a combination - logical OR after
thresholding - of the previous three masks).
These are overlaid on the coregistered and resampled T1w image below, to allow visual inspection of segmentation
and registration quality.
Anatomical regions of interest were taken from the cytoarchitecture-based atlases in the SPM
Anatomy Toolbox.
For the motor cortex, regions 4a and 4p were used. For the amygdala, regions LB, IF, SF, MF, VTM, and CM were
used.
Regions of interest were transformed from MNI152 space to the subject functional space using SPM12
normalise/write, as well as
the inverse transformation field that was saved as part of the segemntation procedure mentioned above.
The regions of interest for this study include the left motor cortex (for the motor task runs) and the bilateral
amygdala (for the emotion task runs).
These ROIs are overlaid on the coregistered and resampled T1w image below, to allow visual inspection of
normalisation quality.
For functional quality reporting, several processing steps are executed on several data sources, including the
functional time series, head movement parameters and physiology data.
Statistical measures are calculated from the time series data, yielding spatial QC measures (e.g. standard
deviation and temporal signal to noise ratio maps) and timeseries visualisations (e.g. framewise displacement,
grayplots, etc).
If physiology data are available for a run, quality metrics for these are extracted from the PhysIO pipeline
included as a dependency in this toolbox.
The following QC measures are derived and displayed below:
| Functional run | Mean framewise displacement (mm) | Total framewise displacement (mm) | FD outliers (thresh 0.2mm) | FD outliers (thresh 0.5mm) | Mean Zscore | Global correlation | Mean tSNR (GM) | Mean tSNR (WM) | Mean tSNR (CSF) | Mean tSNR (brain) |
|---|